|
Schedule (行事曆)
|
| W | Topics |
|---|
| 01 | • 1. Introduction |
| 02 | • 2. Introducing D3 |
| 03 | • 3. Technology Fundamentals |
| 04 | • 4. Setup |
| 05 | • 5. Data |
| 06 | • 6. Drawing with Data |
| 07 | • 7. Scales |
| 08 | • 8. Axes Project Presentation |
| 19 | • 9. Updates, Transitions, and Motion |
| 10 | • 10. Interactivity |
| 11 | • 11. Using Paths |
| 12 | • 12. Selections |
| 13 | • 13. Layouts |
| 14 | • 14. Geomapping |
| 15 | • 15. Exporting |
| 16 | • 16. Project Walk-Through |
| 17 | • A. Case Studies • B. What's New in 4.0 • C. Further Study |
| 18 | • D. Sharing Your Code • E. Quick Reference |
|
|
 |
|
Syllabus
|
- Lecture:
- • Friday 13:10-16:00.
- Location:
- • Pioneer International R&D Building 401(e)
- • 先鋒 401(e)
- • Hong-Yue technology Research Building 1223
- • 科研大樓 1223
- Class webpage:
-
- • 網頁 https://tjhsieh.github.io/c/vis/vis2023f/
- Submissions:
-
- • 北科i學園 PLUS https://istudy.ntut.edu.tw/learn/index.php
- Instructor:
- • Prof. H s i e h
- • Office: Technology Building 1535
- • Office hours: TBA
- Teaching Assistant:
- • TBA
- • Office: Technology Building 1422
- • Office hours: TBA
- Textbook:
- • Scott Murray, Interactive Data Visualization for the Web, 2nd Edition, O'Reilly, ISBN: 9781491921289.
- Reference Book:
- • Tamara Munzner, Visualization Analysis and Design.
- Grading: (暫定)
- • 70% programming assignments
- •
30% class participation (簽到、期中上台報告、期末上台報告)
- • 10% class participation (先鋒401教室,十次簽到)
- • 10% class participation (11.03 期中計畫-美術館-資料收集中)
- • 10% class participation (12.29 期末計畫-美術館-資料視覺化)
- Outline: (from Catalog)
-
• Data visualization plays an important role in a variety of study fields. This course includes the following topics: Data and Image Models, Visual Perception and Cognition, Process of Data Visualization, Space Perception and Display of Data in Space, Purpose of Color and Principles of Using Color in Visualization and UI Design, Interaction Models, Browsing and Navigation, Multivariate and Multidimensional Data, Trees and Graphs for Representing Hierarchies and Complex Relations, Evaluation of Visualization Design.
- Policies:
- • No late homework will be accepted.
- • A regrade request must be submitted within one week after the original grade is received.
- • Students are not allowed to copy solutions from others, and students should not share your answers with others. Students will receive a score of zero for doing this.
- • Academic Honesty: (uci) (columbia)
- • 國立臺北科技大學 考試規則
- • 國立臺北科技大學 學生獎懲辦法
- • Be sure to check the course website frequently.
|
|
|
|
|
Udacity
|
|
Data Visualization and D3.js
udacity.html
https://bost.ocks.org/mike/
|
|
|
|
|
ACM 計算機協會 Association for Computing Machinery
|
|
| |
|
ACM Transactions on Graphics
ACM Journal on Computing and Cultural Heritage
ACM has partnered with Overleaf, to provide an ACM LaTeX authoring template for all ACM journals and conferences. To produce a JOCCH submission, please use the ACM Large template on OverLeaf. JOCCH authors just need to set the \acmJournal{} parameter to \acmJournal{JOCCH}
Special Issue on Culture Games
Visual Computing for Cultural Heritage
|
|
|
|
|
IEEE 電機電子工程師學會 Institute of Electrical and Electronics Engineers
|

|
| |
|
IEEE Transactions on Visualization and Computer Graphics
IEEE VIS 2023
PacificVis 2023
EuroVis 2023
IEEE Computer Graphics and Applications
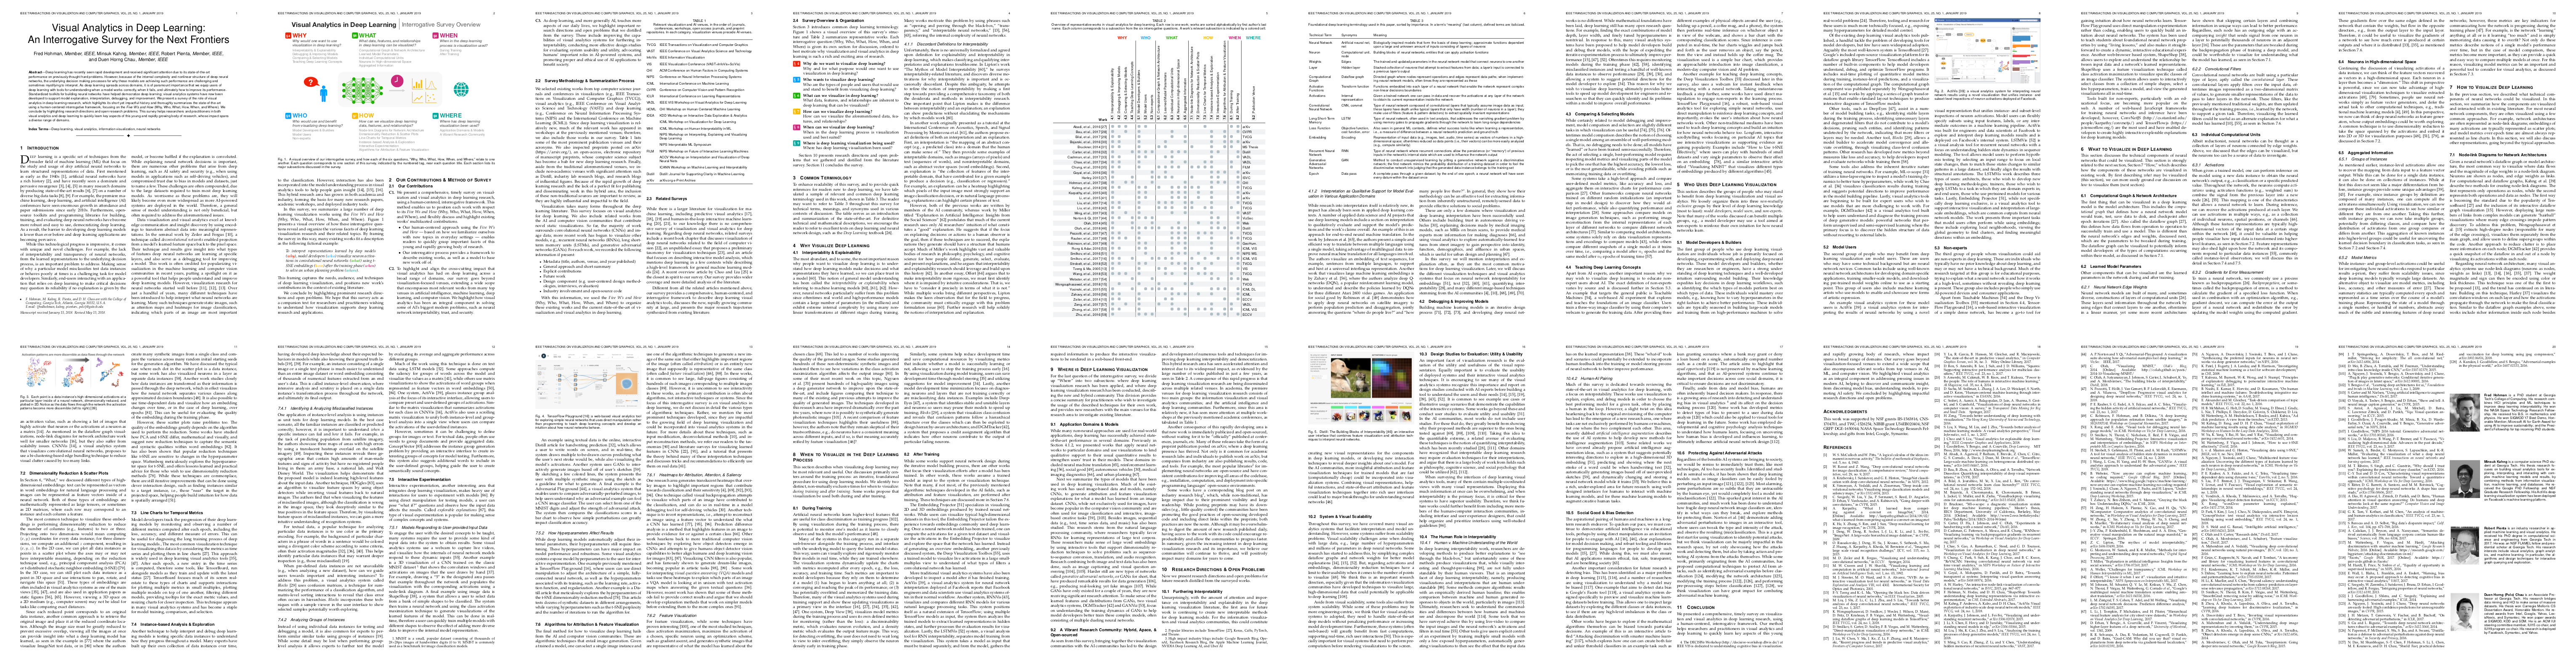
Visual Analytics in Deep Learning: An Interrogative Survey for the Next Frontiers
|
|
 |
| |
|
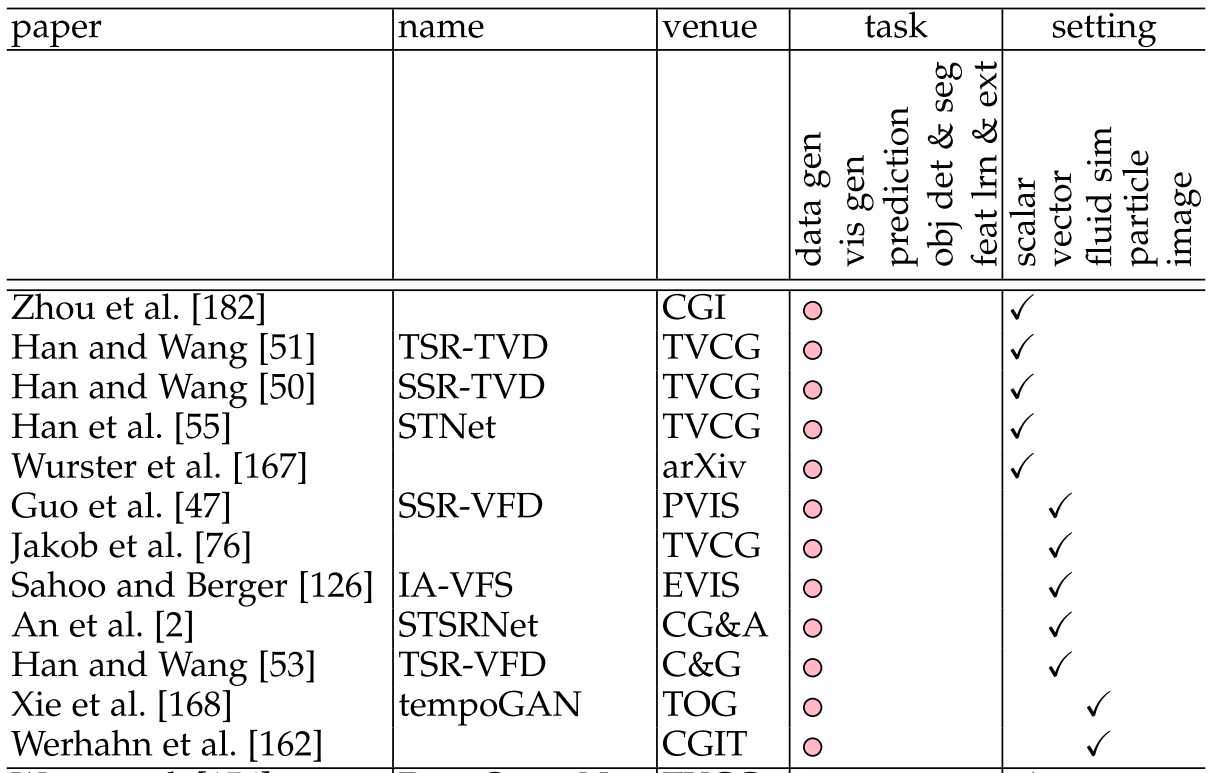
DL4SciVis: A State-of-the-Art Survey on Deep Learning for Scientific Visualization
|
|
 |
|
|
|
|
國家表演藝術中心
|


|
數據再登場 兩廳院售票消費行為年度報告
兩廳院售票系統 2013~2018年消費行為報告
國家表演藝術中心
|
|
|
|
|
Visualization for Machine Learning
|
| |
Visualization for Machine Learning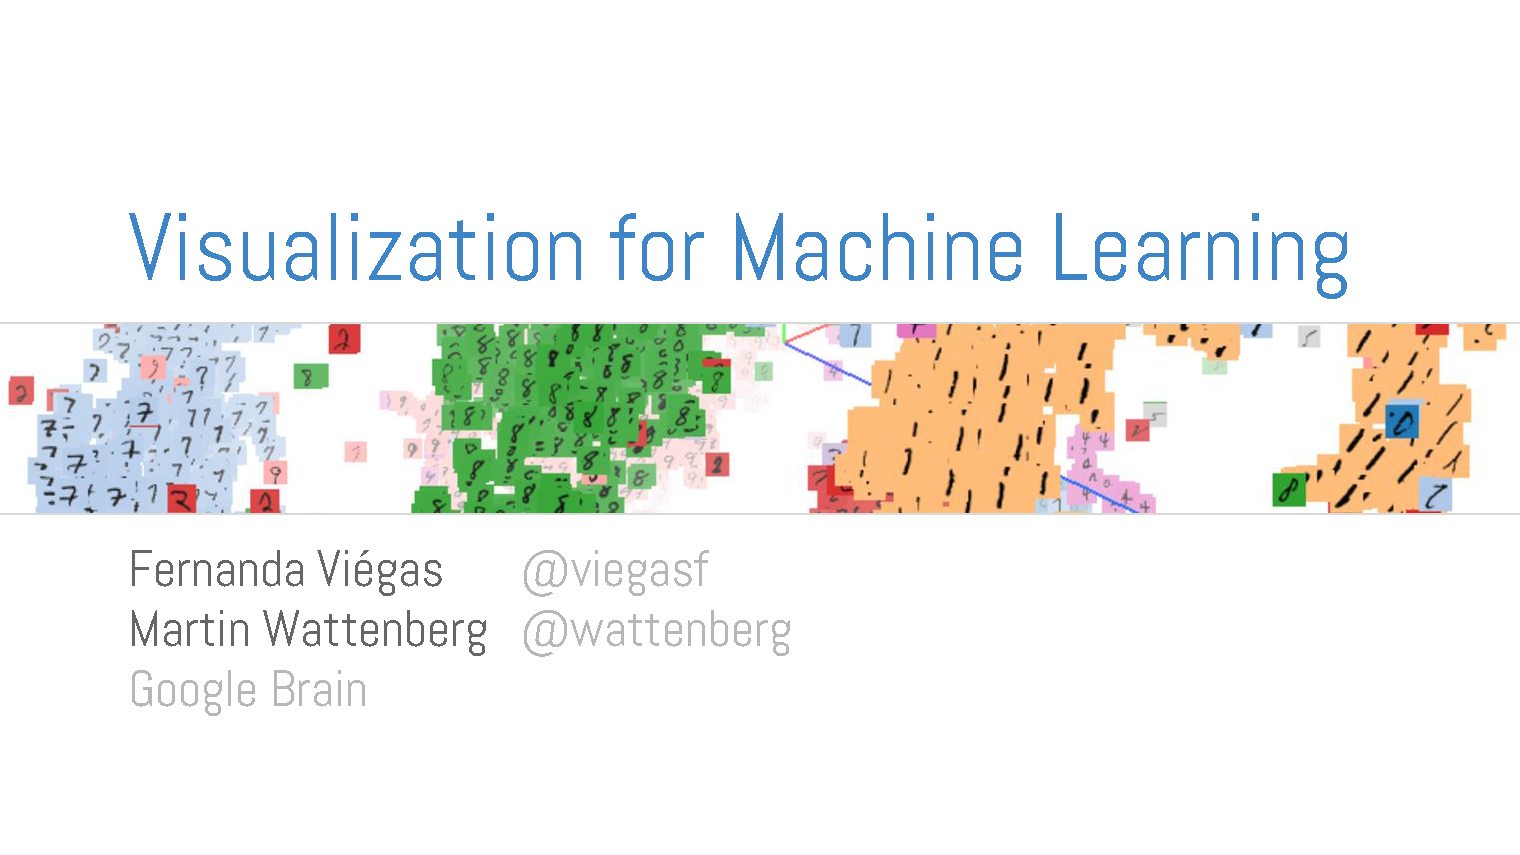
|
|
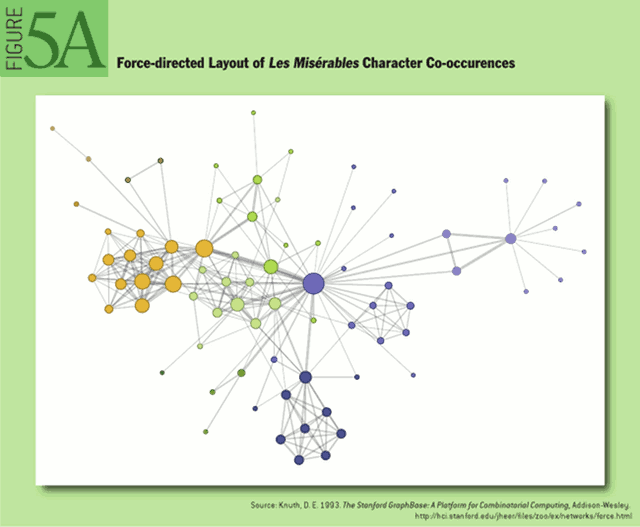
A Tour through the Visualization Zoo
|
| |
|
|
|
|
Udacity
|
Data Visualization and D3.js

|
|
|
|
| |
麻省理工學院博物館 (MIT Museum)

The Polaroid Project Online 寶麗來關於展覽
在鼎盛時期,寶麗萊及其產品受到數百萬業餘愛好者的喜愛,並受到無數專業人士的擁戴。寶麗來項目講述了寶麗來公司引人入勝且富有啟發性的故事,並展示了寶麗來攝影的各個方面,包括使其成為可能的技術。在環遊世界之後,這場廣受好評的展覽於 2019 年 10 月在麻省理工學院博物館開幕,距離首次發明即時膠片的地方大約只有一個街區。
由於新冠肺炎 (COVID-19) 危機,博物館宣佈於 2020 年 3 月 13 日停止向公眾開放,就在寶麗來項目第二部分開放一周後。在畫廊展覽結束之前,博物館不會再次開放。
我們很高興在網上舉辦這個虛擬展覽,通過原創作品和文物展示非凡的寶麗來故事。此 3D 演練包括策展人 Deborah Douglas、William Ewing 和 Barbara Hitchcock 的音頻註釋。
師大美術館

師大美術館

|
|
|
|
|